Exploring Neighborhood Change
Atlanta, Georgia
About the Map
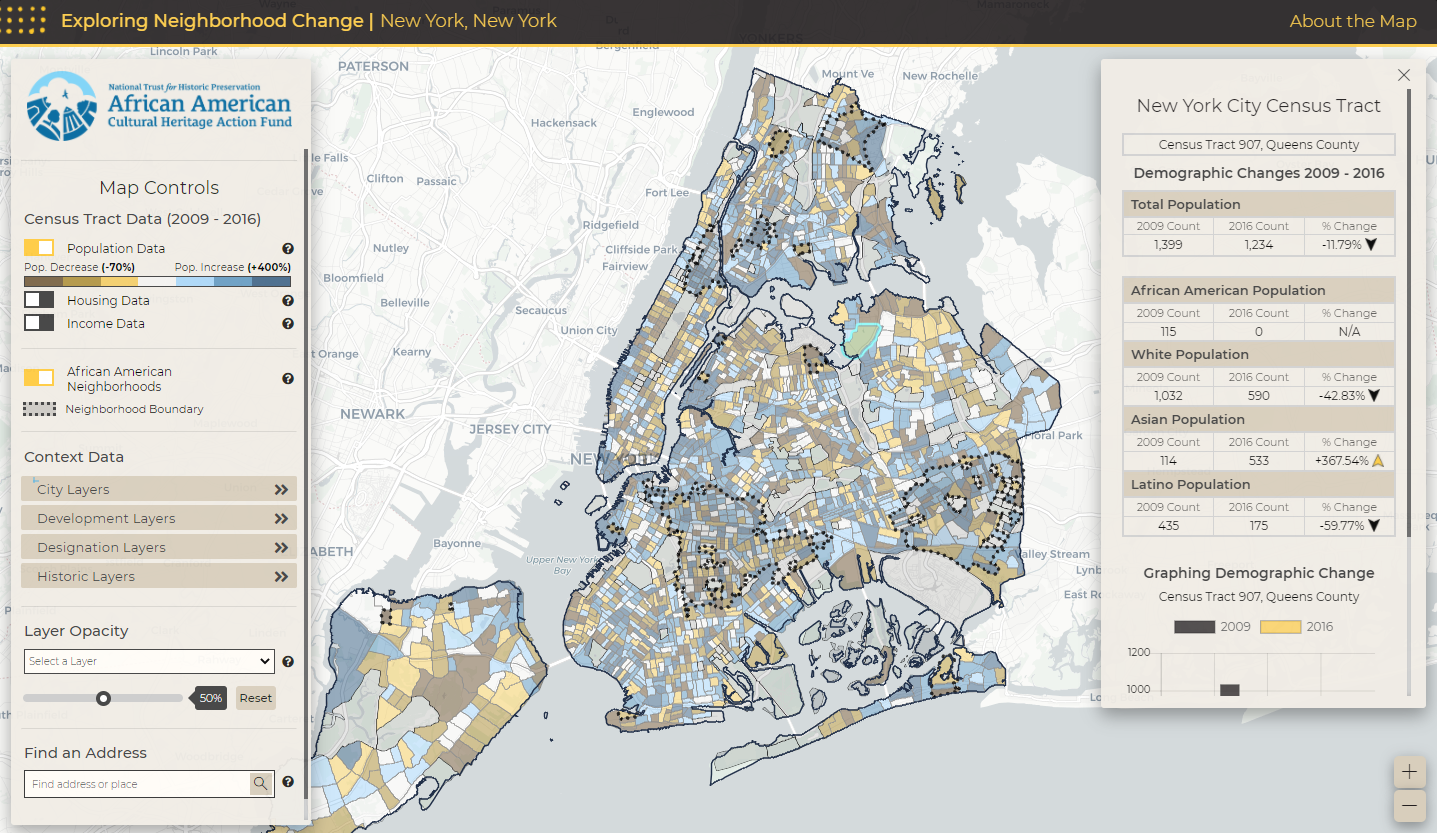
The National Trust for Historic Preservation developed the Exploring Neighborhood Change mapping series for 10 cities as a part of an initiative of the African American Cultural Heritage Action Fund. The mapping series is designed to complement a written report entitled Preserving African American Places: Growing Preservation’s Potential as a Path for Equity, which explores the historical and present day context of African American neighborhoods to develop effective preservation-based strategies that promote justice, inclusion, and equity in our movement today.
This initiative is focused on exploring the intersection of preservation and equitable development in African American neighborhoods in 10 cities where the National Trust is actively engaged and holds longstanding partnerships. While the focus of this initial exploration is on African American neighborhoods, we believe the lessons and insights gleaned can apply to other neighborhoods of diverse racial and cultural identity. This mapping tool helps readers of the report visualize census tracts in the 10 cities that have had predominantly African American populations for the last fifty years. The mapping tool offers a snapshot of demographic change between 2009 and 2016 as well as a variety of contextual data layers including transit, presence of institutions, preservation activity, development activity, historical redlining data, among others, to support broader understanding of these neighborhoods where change is taking place.
This map is best used in close reference to the report, and when readers conduct their own supplemental research and/or bring their own knowledge of these communities to bear. Alone, the data presented does not offer insight into why these changes are occurring, but it does serve as a starting point to help readers visualize and explore the complex range of factors that influence neighborhood change. Examples of map uses include:
- Overlaying historic neighborhood risk assessment maps (also known as “redline” maps) created in the 1930s by the Home Owners’ Loan Corporation with present day data layers to explore spatial trends in residential and economic segregation, among other areas.
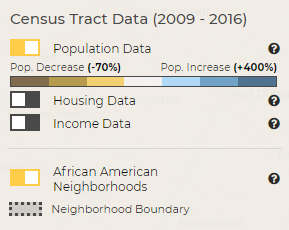
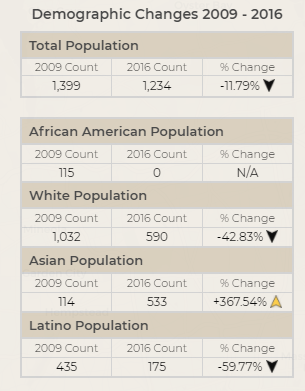
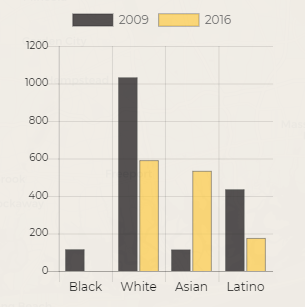
- Exploring changes in population, median income, and housing value between 2009 – 2016 at the census tract level.
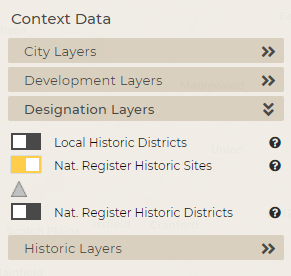
- Visualizing neighborhood characteristics, preservation activity, development activity, and zoning data to identify gaps and inform local strategies to strengthen these communities.
The National Trust will continue to work with practitioners and residents of study cities to customize the Exploring Neighborhood Change mapping series to reflect local circumstances that will help advance our understanding of neighborhood change and the factors that drive it.
The Ford Foundation and the JPB Foundation provided the National Trust for Historic Preservation’s African American Cultural Heritage Action Fund with the generous funding to work on this mapping series and the broader campaign.